Note
Go to the end to download the full example code.
Post-Anomaly Detection Inference for Deep SVDD (Tabular Data)
This example shows how to perform selective inference for Deep Support Vector Data Description (Deep SVDD) on tabular data using the pythonsi library. The method computes statistically valid p-values to control the False Positive Rate (FPR) in a post-hoc manner. The implementation is based on the work by Thanh et al. (2026) [1].
[1] Thanh, C. L. C., Vinh, D. Q., & Duy, V. N. L. (2026). Post-Anomaly Detection Inference for Deep SVDD. arXiv preprint arXiv:2609.37935.
import sys
import os
from pathlib import Path

# Add pythonsi to module search path
# REPO = Path(__file__).resolve().parent
# while REPO.name and not (REPO / "pythonsi").exists():
#     REPO = REPO.parent
# sys.path.insert(0, str(REPO))

import numpy as np
import torch
import matplotlib.pyplot as plt

from pythonsi import Data, Pipeline
from pythonsi.anomaly_detection import DeepSVDDAD
from pythonsi.test_statistics import DeepSVDDTestStatistic

# Add dnn directory to path to import network
# sys.path.insert(0, str(Path(__file__).resolve().parent / "deepsvdd" / "dnn"))
from models.deepsvdd.dnn.network import MLP
Configuration
SEED = 42
N_FEATURES = 50
N_REFS = 20
ALPHA = 0.05

DEVICE = "cuda" if torch.cuda.is_available() else "cpu"
Load Trained Model
script_dir = Path(__file__).resolve().parent
ckpt_path = "./models/deepsvdd/dnn/weights/mlp_encoder.pth"
ckpt = torch.load(ckpt_path, map_location=DEVICE, weights_only=False)
cfg = ckpt["config"]

model = MLP(
    n_features=cfg["n_features"],
    hidden_dim=cfg["hidden_dim"],
    repdim=cfg["repdim"],
).to(DEVICE)
model.load_state_dict(ckpt["model_state_dict"])
model.eval()

center_c = ckpt["center_c"]
R_squared = ckpt["R_squared"] * 0.7
print(f"R² = {R_squared:.10f}")
R² = 0.2253899843
Generate Test & Reference Data
rng = np.random.default_rng(SEED)

# Reference data: normal N(0,1)
X_refs = rng.normal(size=(N_REFS, N_FEATURES)).astype(np.float64)

# Test data: anomalous (shifted mean)
X_test = rng.normal(size=(1, N_FEATURES)).astype(np.float64)

# Check if test triggers anomaly
with torch.no_grad():
    feat = model(torch.from_numpy(X_test).float().to(DEVICE))
    score = torch.sum((feat - torch.tensor(center_c, device=DEVICE)) ** 2).item()

print(f"Score:  {score:.10f}")
print(f"R²:     {R_squared:.10f}")
print(f"Anomaly detected: {score > R_squared}")
Score:  0.2512427866
R²:     0.2253899843
Anomaly detected: True
Build Pipeline & Compute Selective p-value
test_node = Data()
refs_node = Data()

detector = DeepSVDDAD(
    model=model,
    R_squared=R_squared,
    center=center_c,
    device="cpu",
    network_type="dnn",
)
anomaly_node = detector.run(test_node)

pipeline = Pipeline(
    inputs=(test_node, refs_node),
    output=anomaly_node,
    test_statistic=DeepSVDDTestStatistic(test_node, refs_node),
)

print("Running selective inference …")
anomalies, p_values = pipeline(
    inputs=[X_test, X_refs],
    covariances=[np.eye(N_FEATURES)],
    verbose=False,
)

print(f"\nDetected anomalies: {anomalies}")
print(f"Selective p-values: {p_values}")

if len(p_values) > 0 and p_values[0] is not None:
    print(f"Reject H₀ at α={ALPHA}? {'YES' if p_values[0] < ALPHA else 'NO'}")
Running selective inference …

Detected anomalies: [0]
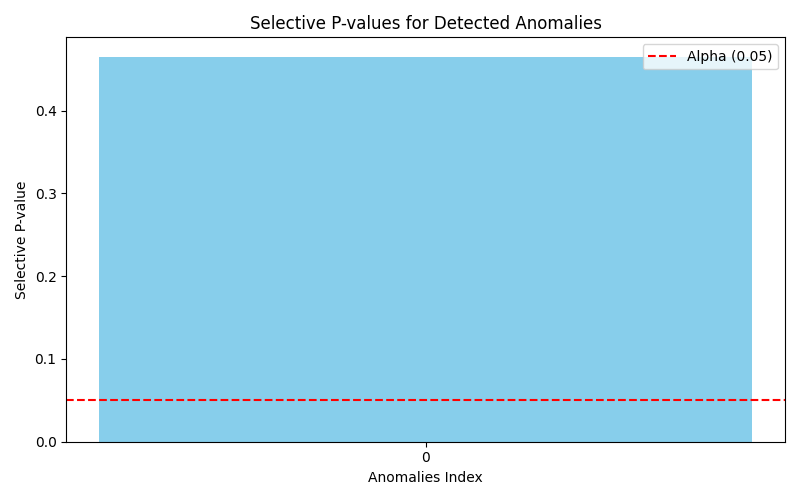
Selective p-values: [0.46534214671927887]
Reject H₀ at α=0.05? NO
Plot the p-values
plt.figure(figsize=(8, 5))
plt.bar([str(anomaly) for anomaly in anomalies], p_values, color='skyblue')

plt.axhline(y=ALPHA, color='red', linestyle='--', label=f'Alpha ({ALPHA})')

plt.xlabel("Anomalies Index")
plt.ylabel("Selective P-value")
plt.title("Selective P-values for Detected Anomalies")
plt.legend()
plt.tight_layout()
plt.show()