Note
Go to the end to download the full example code.
Selective Inference for Autoencoder-based Anomaly Detection after Representation Learning-based Domain Adaptation
This example shows how to perform selective inference for Autoencoder-based Anomaly Detection after Representation Learning-based Domain Adaptation using the pythonsi library. The method is based on the work by Kiet et al. (2025)[7].
[7] Kiet, T. T., Loi, N. T., & Duy, V. N. L. (2025). Statistical inference for autoencoder-based anomaly detection after representation learning-based domain adaptation. arXiv preprint arXiv:2508.07049.
# Author: Tran Tuan Kiet

from pythonsi import Pipeline, Data
from pythonsi.domain_adaptation import RepresentationLearningDA
from pythonsi.anomaly_detection import AutoEncoderAD
from pythonsi.test_statistics import AD_DATestStatistic
import numpy as np
import matplotlib.pyplot as plt
from models.wdgrl import Generator
from models.ae import AutoEncoder
from typing import List
import torch
Generate Data
def gen_data(mu: float, delta: List[int], n: int, d: int, alpha: float = 0.05):
mu = np.full((n, d), mu, dtype=np.float64)
noise = np.random.normal(loc=0, scale=1, size=(n, d))
X = mu + noise
labels = np.zeros(n)
# 5% of the data is abnormal.
# Anomalies are generated by randomly adding deltas to the data.
n_anomalies = min(20, int(n * alpha))
idx = np.random.choice(n, n_anomalies, replace=False)
if len(delta) == 0:
return X, labels
split_points = sorted(
np.random.choice(range(1, len(idx)), len(delta) - 1, replace=False)
)
segments = np.split(idx, split_points)
for i, segment in enumerate(segments):
X[segment] = X[segment] + delta[i]
labels[idx] = 1
return X, labels, np.identity(n * d)
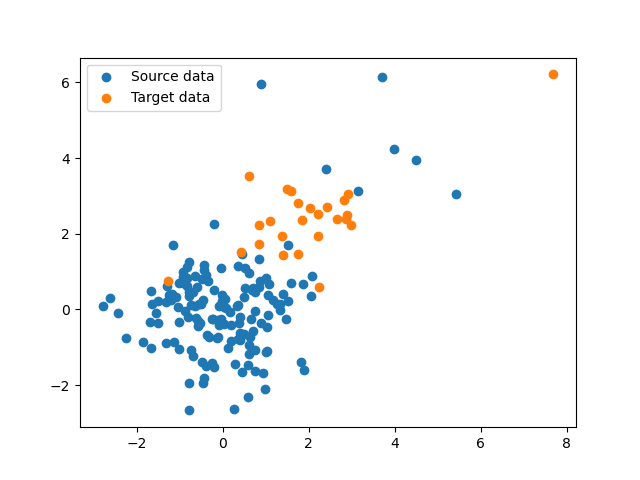
ns, nt, d = 150, 25, 32
xs, ys, sigma_s = gen_data(0, [4], ns, d)
xt, yt, sigma_t = gen_data(2, [4], nt, d)
plt.scatter(xs[:, 0], xs[:, 1], label="Source data")
plt.scatter(xt[:, 0], xt[:, 1], label="Target data")
plt.legend()
plt.show()
Load pretrained models
feature_extractor = Generator(input_dim=d, hidden_dims=[500, 100])
autoencoder = AutoEncoder(
    input_dim=100, encoder_hidden_dims=[16, 8, 4, 2], decoder_hidden_dims=[2, 4, 8, 16]
)

feature_extractor.load_state_dict(torch.load("./models/weights/feature_extractor.pth"))
autoencoder.load_state_dict(torch.load("./models/weights/autoencoder.pth"))

feature_extractor = feature_extractor.to(torch.float32)
autoencoder = autoencoder.to(torch.float32)
Define the pipeline
def STAND_DA() -> Pipeline:
    xs = Data()
    xt = Data()

    rl_based_da = RepresentationLearningDA(
        model=feature_extractor, device="cuda"
    )  # or "cpu"
    x_tilde = rl_based_da.run(xs=xs, xt=xt)

    autoencoder_ad = AutoEncoderAD(model=autoencoder, device="cuda")  # or "cpu"
    anomaly_indices = autoencoder_ad.run(x=x_tilde, only_target_indices=xt)

    return Pipeline(
        inputs=(xs, xt),
        output=anomaly_indices,
        test_statistic=AD_DATestStatistic(xs=xs, xt=xt),
    )


my_pipeline = STAND_DA()
Run the pipeline
anomalies, p_values = my_pipeline(inputs=[xs, xt], covariances=[sigma_s, sigma_t])

print("Anomalies set: ", anomalies)
print("P-values: ", p_values)
Anomalies set:  [np.int64(10)]
P-values:  [0.9079999670377645]
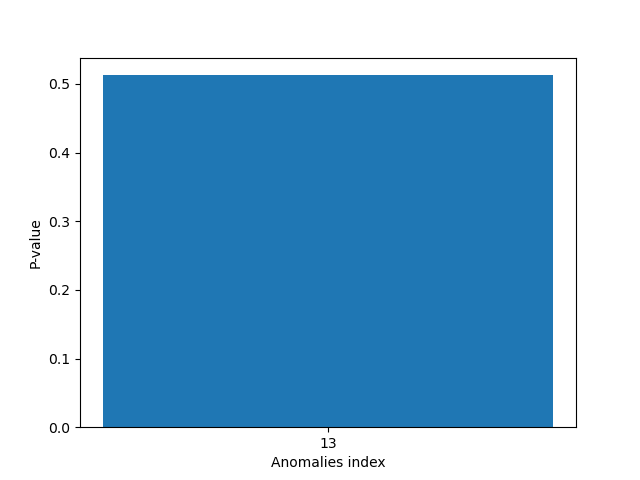
Plot the p-values
plt.figure()
plt.bar([str(anomaly) for anomaly in anomalies], p_values)
plt.xlabel("Anomalies index")
plt.ylabel("P-value")
plt.show()