Note
Go to the end to download the full example code.
Selective Inference for Lasso Feature Selection
This example shows how to perform selective inference for Lasso feature selection using the pythonsi library. The method is based on the work by Duy et al. (2021)[1]. [1] Le Duy, V. N., & Takeuchi, I. (2021, March). Parametric programming approach for more powerful and general lasso selective inference. In International conference on artificial intelligence and statistics (pp. 901-909). PMLR.
# Author: Tran Tuan Kiet

from pythonsi import Pipeline
from pythonsi.feature_selection import LassoFeatureSelection
from pythonsi import Data
from pythonsi.test_statistics import FSTestStatistic
import numpy as np
import matplotlib.pyplot as plt
Define the pipeline
def LassoFS() -> Pipeline:
    x = Data()
    y = Data()

    lasso = LassoFeatureSelection(lambda_=10)
    active_set = lasso.run(x, y)
    return Pipeline(
        inputs=(x, y), output=active_set, test_statistic=FSTestStatistic(x=x, y=y)
    )


my_pipeline = LassoFS()
Generate data
def gen_data(n, p, true_beta):
    x = np.random.normal(loc=0, scale=1, size=(n, p))
    true_beta = true_beta.reshape(-1, 1)

    mu = x.dot(true_beta)
    Sigma = np.identity(n)
    Y = mu + np.random.normal(loc=0, scale=1, size=(n, 1))
    return x, Y, Sigma


x, y, sigma = gen_data(150, 5, np.asarray([0, 0, 0, 0, 0]))
Run the pipeline
selected_features, p_values = my_pipeline([x, y], sigma)
print("Selected features: ", selected_features)
print("P-values: ", p_values)
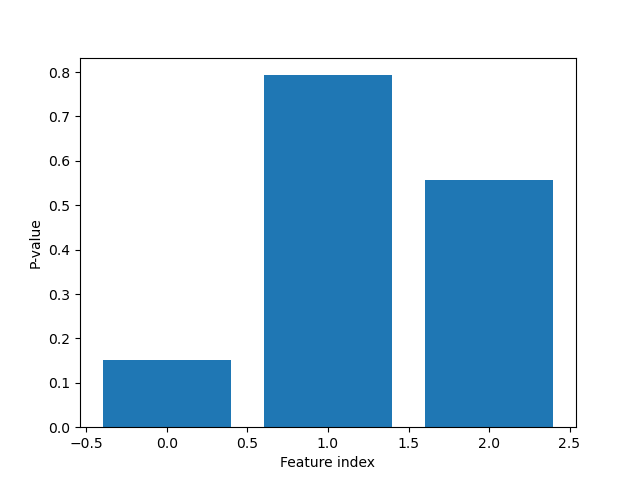
Selected features:  [0 1 2]
P-values:  [0.6143625798813042, 0.06729176111981018, 0.7598409332636703]
Plot the p-values
plt.figure()
plt.bar(range(len(p_values)), p_values)
plt.xlabel("Feature index")
plt.ylabel("P-value")
plt.show()