Note
Go to the end to download the full example code.
Selective Inference for Sequential Feature Selection
This example demonstrates how to perform selective inference for Sequential Feature Selection using the pythonsi library. The method is based on the work by Tibshirani et al. (2016)[2]. [2] Tibshirani, R. J., Taylor, J., Lockhart, R., & Tibshirani, R. (2016). Exact post-selection inference for sequential regression procedures. Journal of the American Statistical Association, 111(514), 600-620.
# Author: Duong Tan Loc

from pythonsi import Pipeline
from pythonsi.feature_selection import SequentialFeatureSelection
from pythonsi import Data
from pythonsi.test_statistics import FSTestStatistic
import numpy as np
import matplotlib.pyplot as plt
Define the pipeline
def SeqFS(k, sigma=None) -> Pipeline:
    x = Data()
    y = Data()

    seqfs = SequentialFeatureSelection(
        n_features_to_select=k, direction="forward", criterion=None
    )
    active_set = seqfs.run(x, y, sigma)
    return Pipeline(
        inputs=(x, y), output=active_set, test_statistic=FSTestStatistic(x=x, y=y)
    )
Generate data
def gen_data(n, p, true_beta):
    x = np.random.normal(loc=0, scale=1, size=(n, p))
    true_beta = true_beta.reshape(-1, 1)

    mu = x.dot(true_beta)
    Sigma = np.identity(n)
    Y = mu + np.random.normal(loc=0, scale=1, size=(n, 1))
    return x, Y, Sigma


x, y, sigma = gen_data(150, 5, np.asarray([0, 0, 0, 0, 0]))
k = 2
my_pipeline2 = SeqFS(k, sigma=sigma)
Run the pipeline
selected_features, p_values = my_pipeline2([x, y], sigma)
print("Selected features: ", selected_features)
print("P-values: ", p_values)
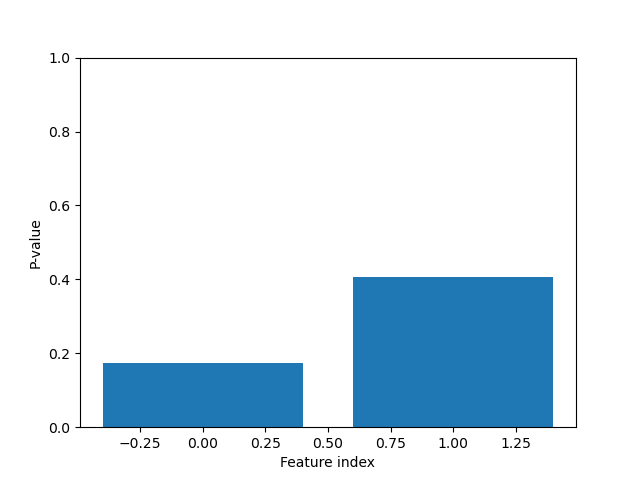
Selected features:  [2, 4]
P-values:  [0.9315545764571751, 0.1515145418449637]
Plot the p-values
plt.figure()
plt.bar(range(len(p_values)), p_values)
plt.xlabel("Feature index")
plt.ylabel("P-value")
plt.ylim((0, 1.0))
plt.show()